

Interest Income Performance
NCBA Group's overall interest income fell by 10.0%, from KES 75.7 billion in FY2024 to KES 68.1 billion in FY2025, reflecting a challenging interest rate environment and lower profitability across key interest-generating assets.
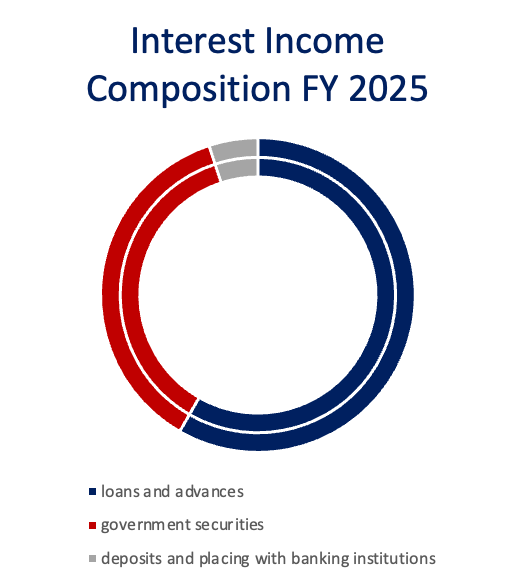
The fall was principally caused by a 14.6% decrease in income from loans and advances to clients, from KES 46.5 billion in FY2024 to KES 39.7 billion in FY2025. This reflects slower credit growth, fewer lending activity, lower lending rates, or a change in the loan portfolio composition throughout the period.
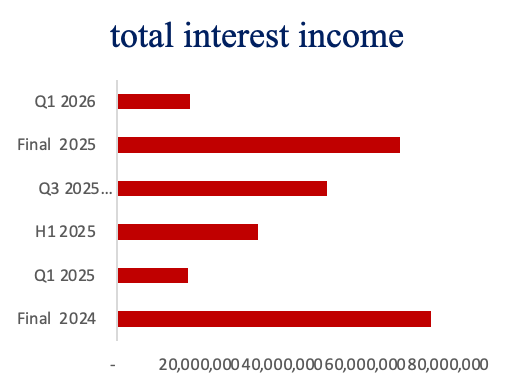
Interest revenue from government securities also declined by 2.6%, from KES 25.7 billion in FY2024 to KES 25.0 billion in FY2025. The drop implies weaker returns from the government's fixed-income securities portfolio, even though government securities continue to contribute significantly to the Group's interest profits.
In contrast, interest revenue from placements with financial institutions climbed by 1.5%, from KES 3.35 billion in FY2024 to KES 3.40 billion in FY2025, reflecting an increase of roughly KES 52 million.
While beneficial, the increase in interbank placements was inadequate to overcome decreases in the Group's major interest-earning businesses.
Interest Expense Performance
NCBA Group's overall interest expense decreased by 41.6%, from KES 41.2 billion in FY2024 to KES 24.1 billion in FY2025, a reduction of KES 17.1 billion. The drop shows a lower cost of capital during the time, which was aided by lower interest rates and better liability management.
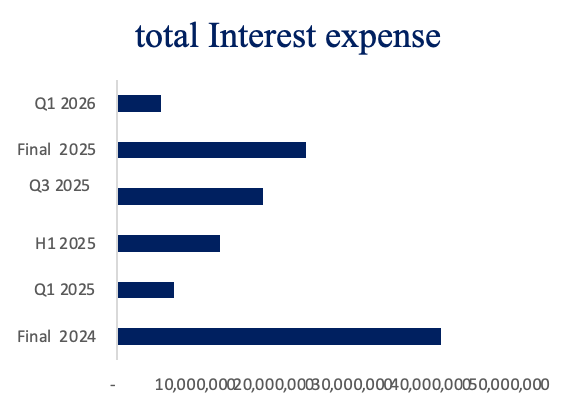
The major contributor to this decline was interest expenditure on customer deposits, which fell by 41.7% from KES 38.2 billion in FY2024 to KES 22.3 billion in FY2025. Given that client deposits are the Group's major funding source, the fall suggests a significant reduction in the cost of mobilizing deposits and increased funding efficiency.
Interest expense on deposits and placements from banking institutions also fell by 53.0%, from KES 1.9 billion in FY2024 to KES 876.6 million in FY2025. This reflects a reduction in reliance on interbank borrowings and placements, as well as decreased interbank funding costs.
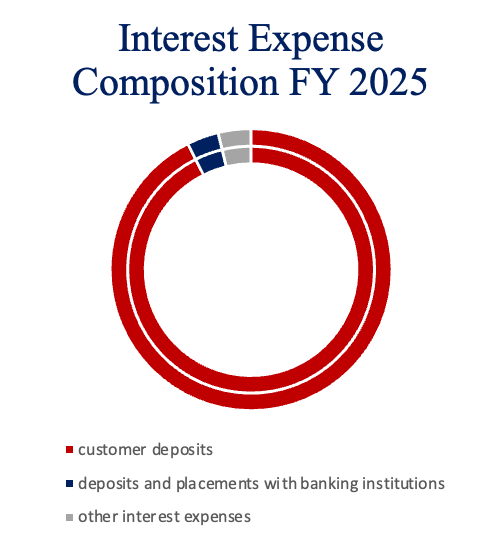
Furthermore, additional interest charges fell by 16.9%, from KES 1.1 billion in FY2024 to KES 906.8 million in FY2025, contributing to the total reduction in funding costs.
Net Interest Income and Non-Funded Income Performance
NCBA Group had strong revenue growth in FY2025, thanks to a significant improvement in net interest income and continuous expansion of non-funded income sources.
Net interest income (NII) increased by 27.7% to KES 44.1 billion in FY2025, up from KES 34.5 billion in FY2024, or KES 9.5 billion. The increase was principally driven by a significant reduction in interest expense, which more than offset the decrease in overall interest income. This demonstrates the Group's ability to improve funding efficiency and increase interest margins throughout the year.

Non-funded income (NFI) increased by 3.8% to KES 29.3 billion in FY2025 from KES 28.2 billion in FY2024, an increase of KES 1.1 billion. Growth in this area was aided by a 6.7% increase in fees and commission income to KES 13.1 billion, indicating increasing transaction volumes and customer activity across the Group's banking platforms.
Additionally, other income increased by 14.7% to KES 11.0 billion, contributing to overall revenue generation and demonstrating the Group's diverse income base.
Total operational income climbed by 17.0% to KES 73.3 billion in FY2025 from KES 62.7 billion in FY2024, a KES 10.6 billion increase, due to growth in both net interest income and non-funded income.

Total operating expenses rose 21.0% to KES 45.4 billion in FY2025, up from KES 38.2 billion in FY2024. The increase in expenses represents higher operating costs due to corporate expansion, technology investments, inflationary pressures, and increasing staff and administrative costs.
Profitability
NCBA Group had good profitability in FY 2025, with profit after tax (PAT) rising by 6.8% to KES 23.4 billion from KES 21.9 billion in FY 2024. Earnings growth was driven by a significant rise in net interest income, growth in earning assets, and resilient non-funded income, despite increasing operational expenses and greater impairment charges this year. The Group's net profit margin fell to 31.9% in FY 2025, down from 34.9% in FY 2024, suggesting that revenue increase was largely offset by higher operational costs and loan loss reserves. While profitability remained strong, margin reduction reflects pressure on earnings efficiency caused by the high-cost environment.

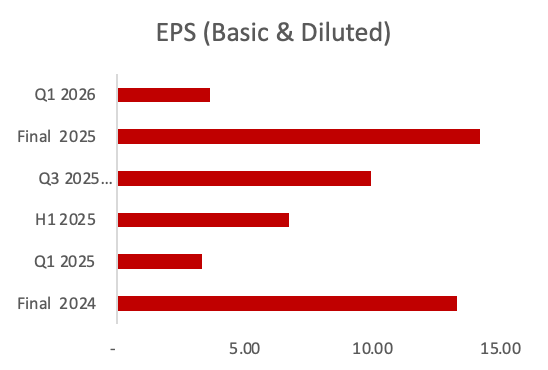
NCBA Group reported a net interest margin (NIM) of 8.2% in FY 2025, demonstrating the Group's sustained capacity to generate significant returns from interest-earning assets while effectively controlling funding expenses. Basic profits per share (EPS) rose 7.0% to KES 14.20 in FY 2025 from KES 13.27 in FY 2024, indicating ongoing earnings growth and value creation for shareholders.
Operating Expenses
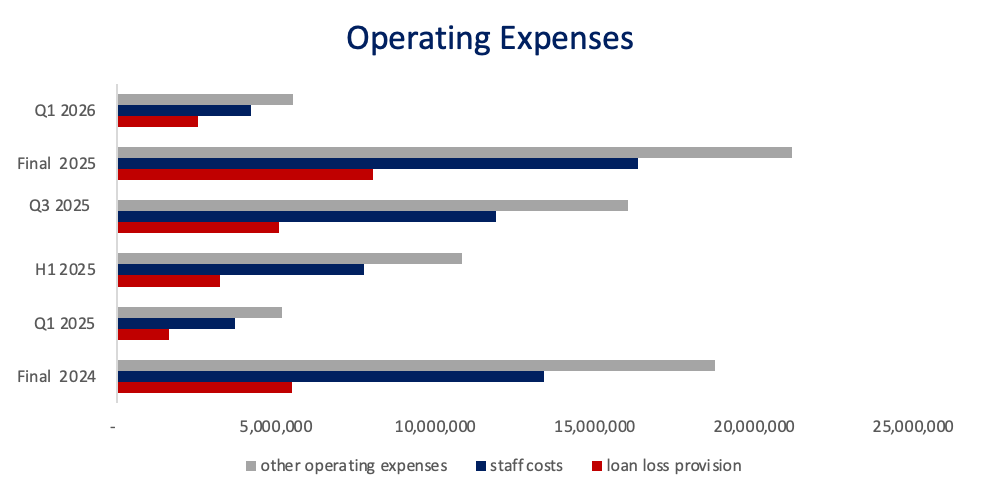
NCBA Group's total operating expenses increased by 21.0% to KES 45.5 billion in FY 2025 from KES 37.6 billion in FY 2024, reflecting continued investment in business growth, technology, and human capital, as well as higher credit impairment charges during the period.
The increase was primarily driven by a 46.3% rise in loan loss provisions to KES 8.0 billion from KES 5.5 billion in FY 2024, representing an additional KES 2.5 billion in impairment charges. This reflects a prudent provisioning approach amid prevailing macroeconomic and credit risk considerations.
Staff costs grew by 21.9% to KES 16.3 billion from KES 13.4 billion, while other operating expenses rose by 12.9% to KES 21.2 billion from KES 18.8 billion in FY 2024, supporting the Group's expanding operations and digital transformation agenda.
As a result, the cost-to-income ratio (including loan loss provisions) increased to 62.1% in FY 2025 from 60.0% in FY 2024. While operating costs grew faster than income during the period, NCBA maintained strong revenue generation and profitability, with the elevated cost base largely attributable to higher impairment charges and strategic investments aimed at supporting future growth.
Balance Sheet Analysis
NCBA Group's balance sheet continued to grow in FY 2025, with total assets rising 7.5% to KES 716.0 billion from KES 665.9 billion in FY 2024. The rise reflects the Group's continuing expansion of loan activities, investment portfolio, and total financial intermediation, which is aided by a strong operating environment.
Net loans and advances to customers increased by 5.0% to KES 317.2 billion, up from KES 302.1 billion in FY 2024, indicating ongoing expansion in the Group's main lending operations across retail, SME, and corporate segments. However, loan book growth remained rather mild, suggesting careful credit underwriting in the face of ongoing macroeconomic uncertainty.
Deposits and balances due from banking institutions fell by 3.0% to KES 51.4 billion from KES 55.1 billion in FY 2024, indicating fewer placements with financial institutions.

Total liabilities rose by 5.8% to KES 588.6 billion from KES 556.2 billion, owing mostly to an increase in client deposits and other liabilities.
Other liabilities increased by 26.8% to KES 38.8 billion from KES 30.6 billion, indicating increasing operational and finance commitments caused by the Group's expanding commercial activities.
Customer deposits, the Group's major financial source, rose 5.9% to KES 531.9 billion from KES 502.0 billion in FY 2024. The steady increase in deposits demonstrates continuous customer confidence and a healthy funding basis. As a result, the loan-to-deposit ratio decreased marginally to 59.6% in FY 2025 from 60.2% in FY 2024, suggesting that deposit growth outperformed loan growth. This increases the Group's liquidity and capacity to support future credit expansion while maintaining a cautious funding profile.
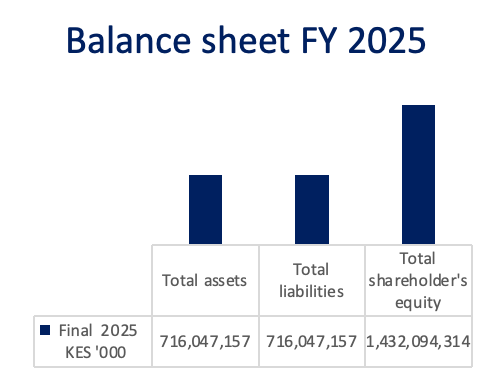
Total shareholder funds increased by 16.1% to KES 127.4 billion, up from KES 109.7 billion in FY 2024. The substantial equity growth was principally driven by retained earnings generated throughout the year, which strengthened the Group's capital position and increased its ability to absorb risk while supporting future business growth.
Asset Quality
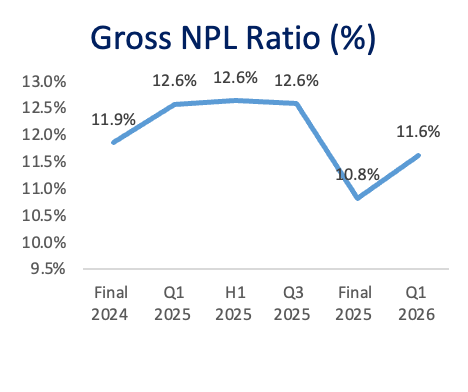
NCBA Group improved asset quality in FY 2025, with gross non-performing loans (NPLs) falling by 3.6% to KES 35.8 billion from KES 37.1 billion in FY 2024. The decrease reflects improved loan recoveries, careful credit underwriting, and better portfolio management across the Group's lending operations.
As a result, the gross NPL ratio improved to 10.8% in FY 2025 from 11.9% in FY 2024, indicating a decrease in impaired assets relative to the entire loan book. The improvement demonstrates that credit quality is improving despite a hard macroeconomic climate and ongoing pressure on some borrowing categories.
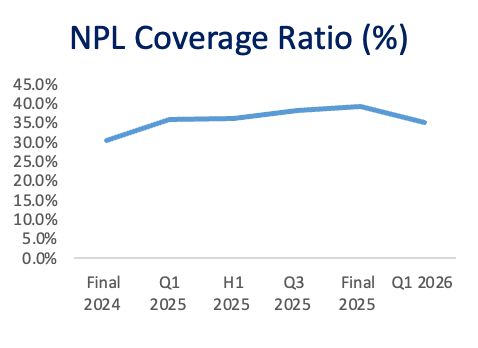
The Group strengthened its credit risk buffers, increasing the NPL coverage ratio to 39.1% in FY 2025 from 30.5% in FY 2024. The greater coverage ratio reflects enhanced provisioning for bad loans, bolstering the Group's ability to absorb possible credit losses and strengthening its balance sheet.
Interest Income Performance NCBA Group's overall interest income fell by 10.0%, from KES 75.7 billion in FY2024 to KES 68.1 billion in FY2025, reflecting a challenging interest rate environment and lower profitability across key interest-generating assets. The fall was principally caused by a 14.6% decrease in income from loans and advances to clients, from KES 46.5 billion in FY2024 to KES 39.7 billion in FY2025. This reflects slower credit growth, fewer lending activity, lower lending rates, or a change in the loan portfolio composition throughout the period. Interest revenue from government securities also declined by 2.6%, from KES 25.7 billion in FY2024 to KES 25.0 billion in FY2025. The drop implies weaker returns from the government's fixed-income securities portfolio, even though government securities continue to contribute significantly to the Group's interest profits. In contrast, interest revenue from placements with financial institutions climbed by 1.5%, from KES 3.35 billion in FY2024 to KES 3.40 billion in FY2025, reflecting an increase of roughly KES 52 million. While beneficial, the increase in interbank placements was inadequate to overcome decreases in the Group's major interest-earning businesses. |
Interest Expense Performance NCBA Group's overall interest expense decreased by 41.6%, from KES 41.2 billion in FY2024 to KES 24.1 billion in FY2025, a reduction of KES 17.1 billion. The drop shows a lower cost of capital during the time, which was aided by lower interest rates and better liability management. The major contributor to this decline was interest expenditure on customer deposits, which fell by 41.7% from KES 38.2 billion in FY2024 to KES 22.3 billion in FY2025. Given that client deposits are the Group's major funding source, the fall suggests a significant reduction in the cost of mobilizing deposits and increased funding efficiency. Interest expense on deposits and placements from banking institutions also fell by 53.0%, from KES 1.9 billion in FY2024 to KES 876.6 million in FY2025. This reflects a reduction in reliance on interbank borrowings and placements, as well as decreased interbank funding costs. Furthermore, additional interest charges fell by 16.9%, from KES 1.1 billion in FY2024 to KES 906.8 million in FY2025, contributing to the total reduction in funding costs.
|
Net Interest Income and Non-Funded Income PerformanceNCBA Group had strong revenue growth in FY2025, thanks to a significant improvement in net interest income and continuous expansion of non-funded income sources. 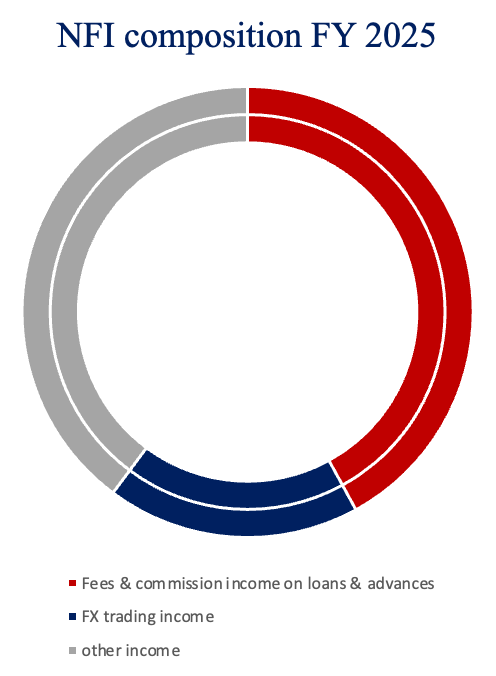 Net interest income (NII) increased by 27.7% to KES 44.1 billion in FY2025, up from KES 34.5 billion in FY2024, or KES 9.5 billion. The increase was principally driven by a significant reduction in interest expense, which more than offset the decrease in overall interest income. This demonstrates the Group's ability to improve funding efficiency and increase interest margins throughout the year. Non-funded income (NFI) increased by 3.8% to KES 29.3 billion in FY2025 from KES 28.2 billion in FY2024, an increase of KES 1.1 billion. Growth in this area was aided by a 6.7% increase in fees and commission income to KES 13.1 billion, indicating increasing transaction volumes and customer activity across the Group's banking platforms. Additionally, other income increased by 14.7% to KES 11.0 billion, contributing to overall revenue generation and demonstrating the Group's diverse income base. Total operational income climbed by 17.0% to KES 73.3 billion in FY2025 from KES 62.7 billion in FY2024, a KES 10.6 billion increase, due to growth in both net interest income and non-funded income. 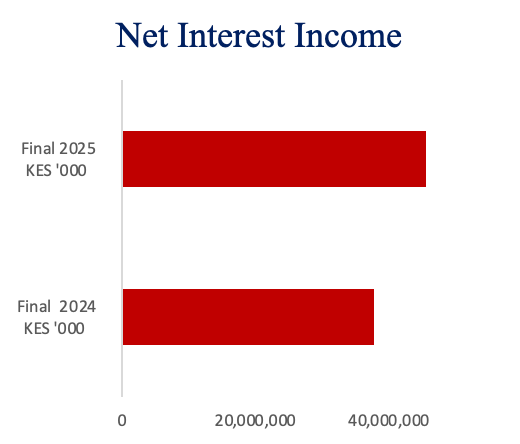 Total operating expenses rose 21.0% to KES 45.4 billion in FY2025, up from KES 38.2 billion in FY2024. The increase in expenses represents higher operating costs due to corporate expansion, technology investments, inflationary pressures, and increasing staff and administrative costs.
|
Profitability NCBA Group had good profitability in FY 2025, with profit after tax (PAT) rising by 6.8% to KES 23.4 billion from KES 21.9 billion in FY 2024. Earnings growth was driven by a significant rise in net interest income, growth in earning assets, and resilient non-funded income, despite increasing operational expenses and greater impairment charges this year. The Group's net profit margin fell to 31.9% in FY 2025, down from 34.9% in FY 2024, suggesting that revenue increase was largely offset by higher operational costs and loan loss reserves. While profitability remained strong, margin reduction reflects pressure on earnings efficiency caused by the high-cost environment. 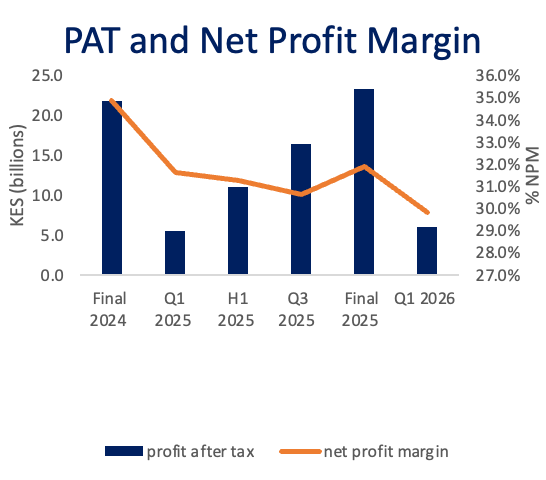 NCBA Group reported a net interest margin (NIM) of 8.2% in FY 2025, demonstrating the Group's sustained capacity to generate significant returns from interest-earning assets while effectively controlling funding expenses. Basic profits per share (EPS) rose 7.0% to KES 14.20 in FY 2025 from KES 13.27 in FY 2024, indicating ongoing earnings growth and value creation for shareholders. |
 Operating Expenses NCBA Group's total operating expenses increased by 21.0% to KES 45.5 billion in FY 2025 from KES 37.6 billion in FY 2024, reflecting continued investment in business growth, technology, and human capital, as well as higher credit impairment charges during the period. The increase was primarily driven by a 46.3% rise in loan loss provisions to KES 8.0 billion from KES 5.5 billion in FY 2024, representing an additional KES 2.5 billion in impairment charges. This reflects a prudent provisioning approach amid prevailing macroeconomic and credit risk considerations. Staff costs grew by 21.9% to KES 16.3 billion from KES 13.4 billion, while other operating expenses rose by 12.9% to KES 21.2 billion from KES 18.8 billion in FY 2024, supporting the Group's expanding operations and digital transformation agenda. 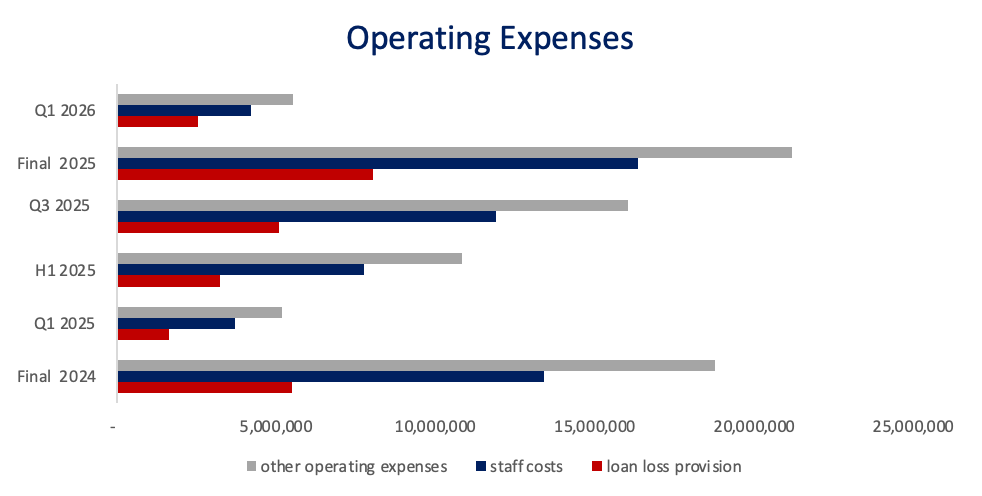 As a result, the cost-to-income ratio (including loan loss provisions) increased to 62.1% in FY 2025 from 60.0% in FY 2024. While operating costs grew faster than income during the period, NCBA maintained strong revenue generation and profitability, with the elevated cost base largely attributable to higher impairment charges and strategic investments aimed at supporting future growth. |
Balance Sheet Analysis NCBA Group's balance sheet continued to grow in FY 2025, with total assets rising 7.5% to KES 716.0 billion from KES 665.9 billion in FY 2024. The rise reflects the Group's continuing expansion of loan activities, investment portfolio, and total financial intermediation, which is aided by a strong operating environment. Net loans and advances to customers increased by 5.0% to KES 317.2 billion, up from KES 302.1 billion in FY 2024, indicating ongoing expansion in the Group's main lending operations across retail, SME, and corporate segments. However, loan book growth remained rather mild, suggesting careful credit underwriting in the face of ongoing macroeconomic uncertainty. 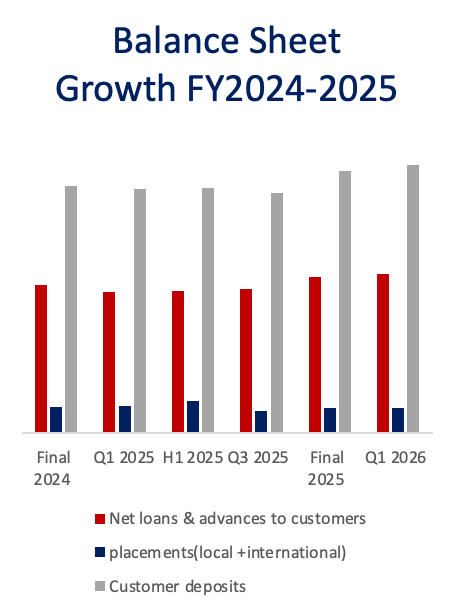 Deposits and balances due from banking institutions fell by 3.0% to KES 51.4 billion from KES 55.1 billion in FY 2024, indicating fewer placements with financial institutions. Total liabilities rose by 5.8% to KES 588.6 billion from KES 556.2 billion, owing mostly to an increase in client deposits and other liabilities. Other liabilities increased by 26.8% to KES 38.8 billion from KES 30.6 billion, indicating increasing operational and finance commitments caused by the Group's expanding commercial activities. Customer deposits, the Group's major financial source, rose 5.9% to KES 531.9 billion from KES 502.0 billion in FY 2024. The steady increase in deposits demonstrates continuous customer confidence and a healthy funding basis. As a result, the loan-to-deposit ratio decreased marginally to 59.6% in FY 2025 from 60.2% in FY 2024, suggesting that deposit growth outperformed loan growth. This increases the Group's liquidity and capacity to support future credit expansion while maintaining a cautious funding profile.  Total shareholder funds increased by 16.1% to KES 127.4 billion, up from KES 109.7 billion in FY 2024. The substantial equity growth was principally driven by retained earnings generated throughout the year, which strengthened the Group's capital position and increased its ability to absorb risk while supporting future business growth.
|
Asset Quality NCBA Group improved asset quality in FY 2025, with gross non-performing loans (NPLs) falling by 3.6% to KES 35.8 billion from KES 37.1 billion in FY 2024. The decrease reflects improved loan recoveries, careful credit underwriting, and better portfolio management across the Group's lending operations.  As a result, the gross NPL ratio improved to 10.8% in FY 2025 from 11.9% in FY 2024, indicating a decrease in impaired assets relative to the entire loan book. The improvement demonstrates that credit quality is improving despite a hard macroeconomic climate and ongoing pressure on some borrowing categories.  The Group strengthened its credit risk buffers, increasing the NPL coverage ratio to 39.1% in FY 2025 from 30.5% in FY 2024. The greater coverage ratio reflects enhanced provisioning for bad loans, bolstering the Group's ability to absorb possible credit losses and strengthening its balance sheet.
|
Outlook
NCBA Group's outlook remains favorable, thanks to anticipated growth in core earnings, balance sheet expansion, and a robust funding basis. Forecasts show that net interest income will continue to rise, owing to a rising interest-earning asset portfolio and continuous customer deposit mobilization. Non-funded income is likely to continue to be a significant contributor to revenue diversification and profitability.
The Group's balance sheet is expected to strengthen significantly, with total assets reaching over KES 741.1 billion by Q1 2026, aided by increases in government securities, client lending, and liquid assets. Customer deposits are expected to increase to KES 587.4 billion in FY 2026, strengthening NCBA's liquidity position and ability to sustain credit growth.
Overall, NCBA's profitability is likely to remain resilient, thanks to careful risk management, a diverse income base, and sustained investment in digital banking capabilities, setting the Group for long-term growth.